Results & Reporting
Viewing Form Totals
How to view aggregated totals for each observation form
Viewing Form Totals
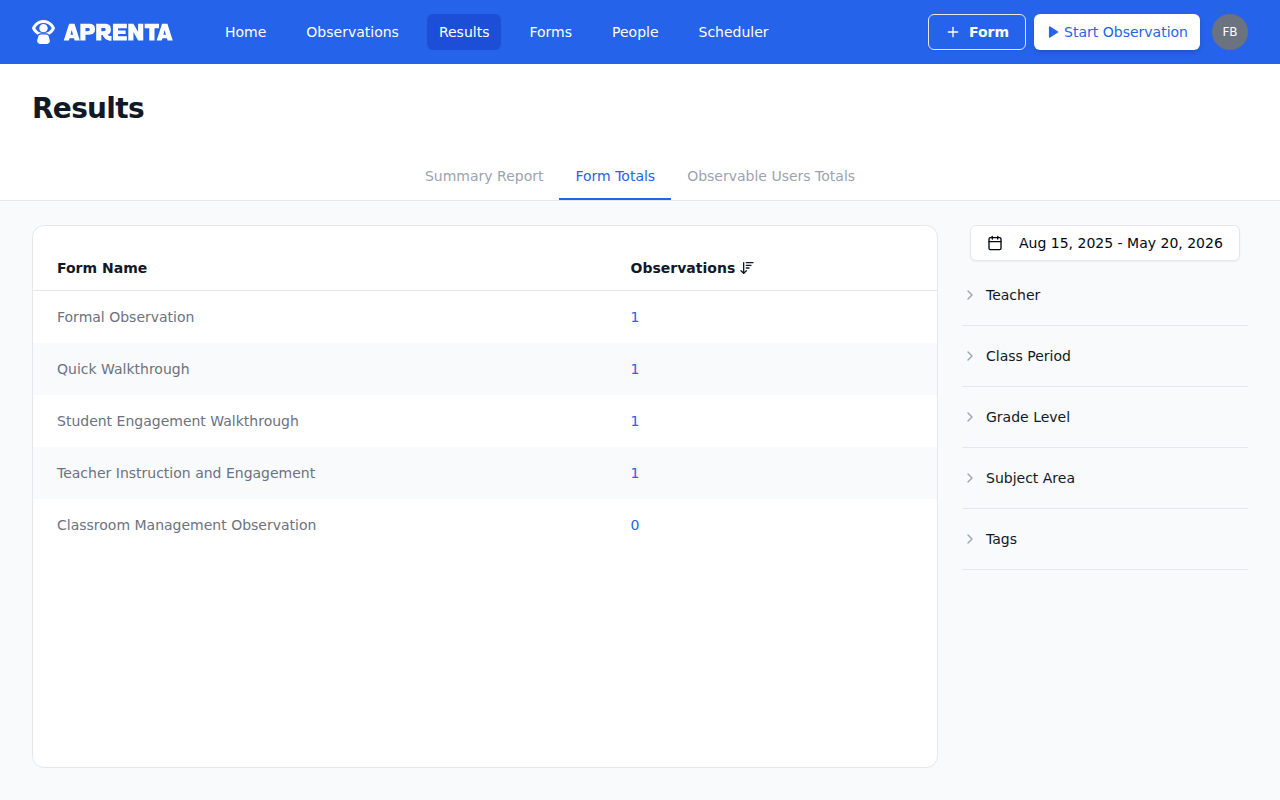
Section titled “Viewing Form Totals”Form Totals gives you a quick count of how many observations have been conducted for each form in your account. Use it to see which forms are actively being used, identify underutilized forms, and understand observation volume at a glance.
Accessing Form Totals
Section titled “Accessing Form Totals”- Click Results in the top navigation bar.
- Select the Form Totals tab.
What You See
Section titled “What You See”The Form Totals tab displays a sortable table with two columns:
| Column | Description |
|---|---|
| Form Name | The name of each observation form |
| Observations | The total number of observations conducted using that form |
By default, the table is sorted by observation count in descending order, so the most-used forms appear first. Click a column header to change the sort order.
Viewing Observations for a Form
Section titled “Viewing Observations for a Form”Click the observation count (the blue number) for any form to navigate directly to the Observations page, pre-filtered to show only observations that used that form. Any active Results filters (date range, school, teacher, categories) carry over to the Observations view.
Filtering Form Totals
Section titled “Filtering Form Totals”The filter panel on the right side of the page applies to Form Totals. You can narrow the results by:
- Date Range — See observation counts for a specific time period (e.g., “Fall Semester” or “Current Academic Year”)
- School — Limit counts to observations from specific schools
- Teacher — See counts from observations involving a specific teacher
- Category — Filter by categories such as Subject Area or Grade Level
How to Use Form Totals
Section titled “How to Use Form Totals”Form Totals helps principals and district leaders answer questions like:
- Which forms are most popular? High counts suggest a form is well-adopted by observers.
- Are any forms underutilized? Low or zero counts may indicate that a form needs promotion, training, or retirement.
- What is overall observation volume? Reviewing totals across forms gives a sense of how actively observations are happening in a school or across the district.